Beautiful Sound
visualizing music
About
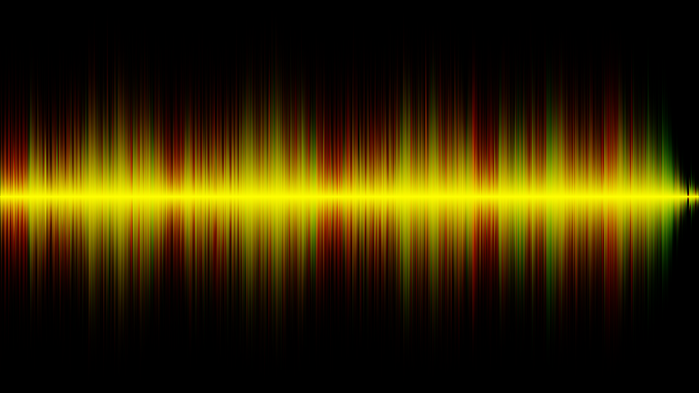
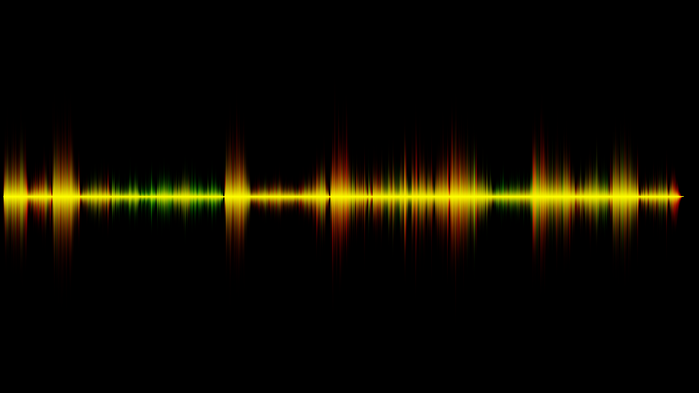
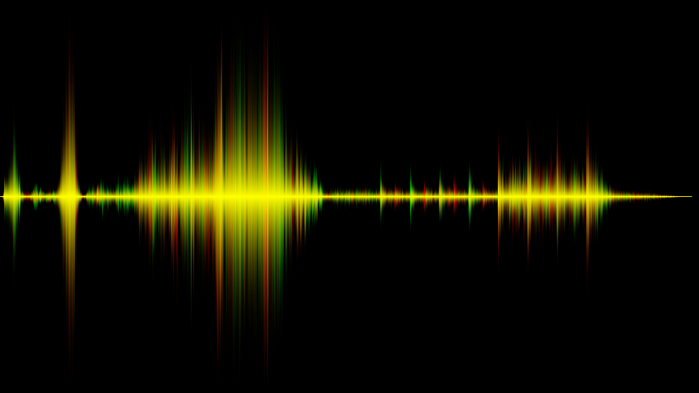
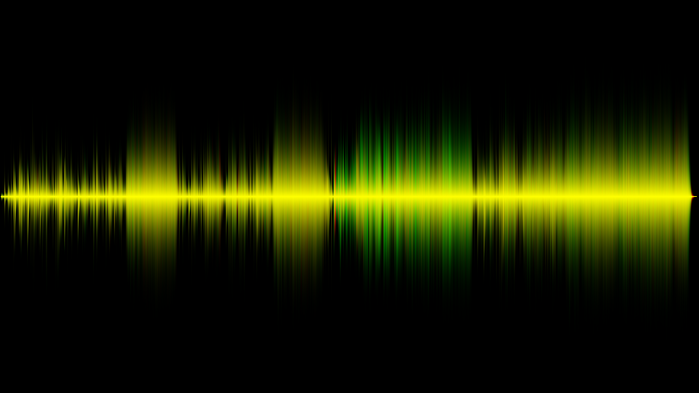
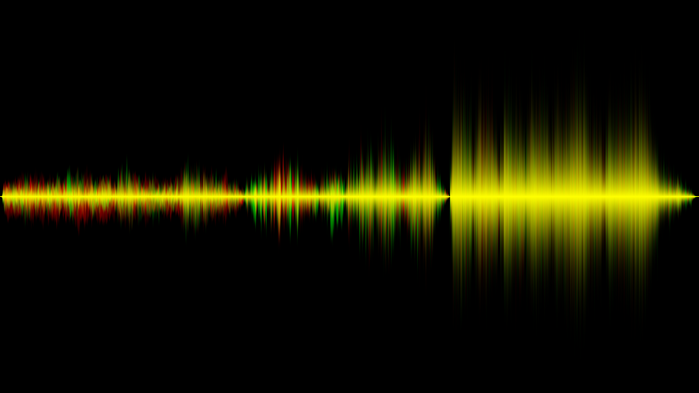
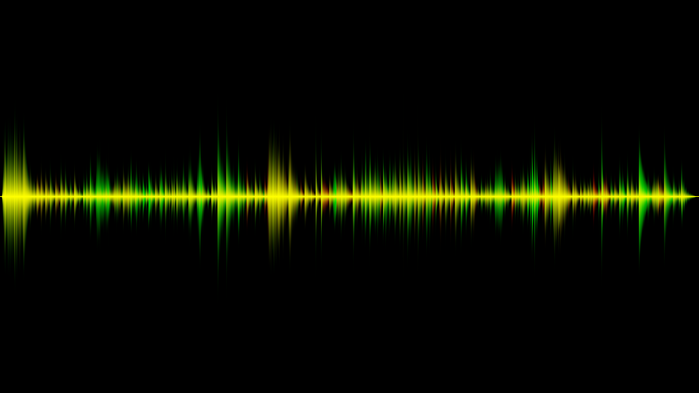
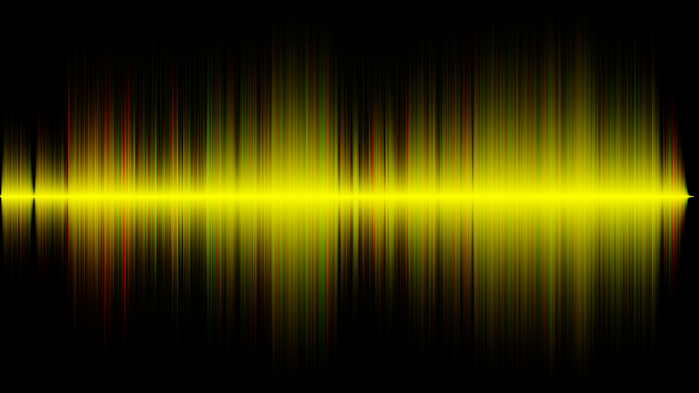
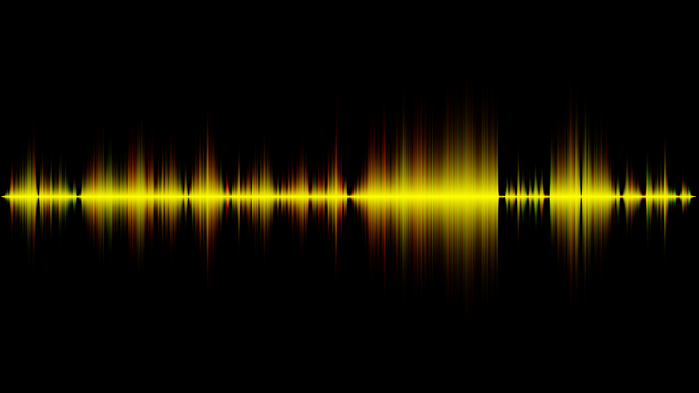
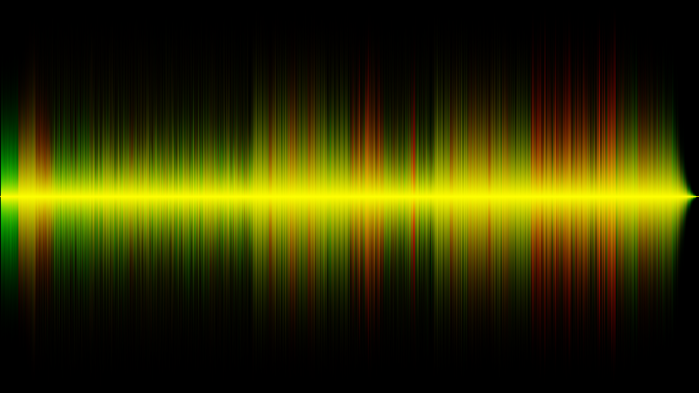
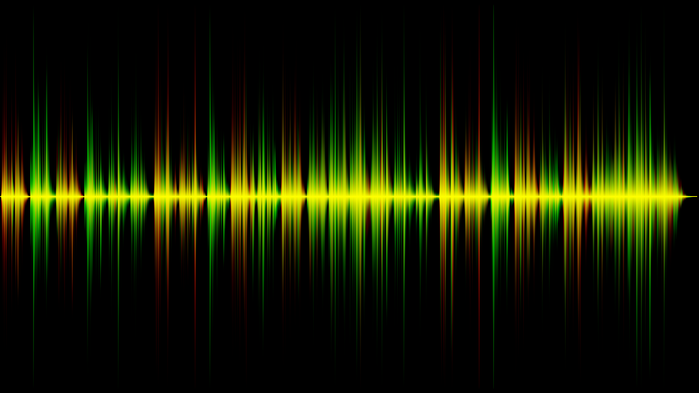
The "Beautiful Sound" project was born in an attempt to understand Digital Signal Processing, with the hope of producing visually pleasing images of music. The full source code is available on GitHub. This page contains some of the graphics generated using the Beautiful Sound tools.
The gallery shows the waveforms of a few songs and compositions. The color intensity is determined by how many PCM samples alias to the given portion of the image. The left stereo channel is represented by the color green, while the right stereo channel is represented by the color red. Yellow is a mix between the two.
Copyright note: the images on this page are for educational purposes only. It is impossible to recover the original recordings from them.
